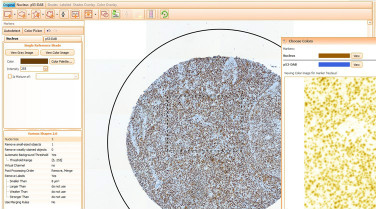
TissueGnostics, the expert in cell counting and intensity measurement, has released the new HistoQuest Software. In it’s 3rd generation HistoQuest continues the advance of FACS-like data analysis and integrates it into an outstanding and intuitive graphical user interface.
HistoQuest uses patented cell-identification algorithms for nuclear segmentation. The intuitive user interface and automated Cut Off Suggestion in combination with the unique Back- and Forward- Connection is an ideal tool for data analysis and data control.
Main features:
Automatic and Semi-Automatic Colour Separation
Immunohistochemistry images must be colour separated for analysis. HistoQuest provides two modes for this – fully automated colour detection for up to three differing colours (counterstaining and two markers) or semi-manual separation for several differing colours.
While the fully automated mode is very fast, the semi-manual mode allows for more fine-tuning. The more differing the colours will be, the better the results
Regions of Interest, Exclusion Regions and Annotations
For a differentiated analysis, Regions of Interest and Exclusion Regions can be drawn on the slide. These shapes can be coloured by the user. Annotations can be made in various forms.
Loading and importing Scan Projects
HistoQuest 3.5 permits the analysis of projects scanned with TissueFAXS/HistoFAXS systems, but also of images of samples scanned with other microsocopes. Digital slides from Mirax, Pannoramica and Hamamatsu scanners can be imported for analysis.
TMA analysis
The analysis of TMA is fully supported. Projects scanned with TissueFAXS/HistoFAXS systems already have TMA spots named in columns within the blocks. For users needing to analyse imported TMA projects from other scanners automatic or manual spot ID capabilities can be integrated into the software.
Automation
HistoQuest 3.5 permits loading more samples of the same type into the analysis project (up to 12, depending on sample size) and analyzing them with the settings elaborated in the first experiment. Profiles for colour separation and segmentation settings can be reused to analyse further samples as well.
New Measurement Parameters
Several new parameters such as Calculated Parameters to measure ratios and the Percentile measurement parameter for intensely stained areas within Measurement Masks are available.
Image Compare Sets
Comparative analyses of consecutive sections of tissue stained with different markers on the same tissue areas can be done by using Image Compare Sets.
Compare Sets
Comparison of graphical data representations (scattergrams, histograms) can be done side by side or in overlays using the Compare Set feature.
Membrane Algorithm
Starting with the 4th generation of our HistoQuest software there is a separate “membrane algorithm” for detection of membrane staining (like Her2neu in breast cancer). The membrane detection (red structures) can be combined with the single-cell identification (green contours).
The system will report to you:
1. What is the total length of membrane staining
2. What is the membrane staining intensity
3. What is the membrane closing radius of each nucleus (360° = full ring around a nucleus, smaller than 360° means the membrane stain is an incomplete ring)
4. Which nuclei don’t have any membrane stain at all.
Data Export
Three data export modes are available to export analysis data. The Raw Data List feature is a list based feature which displays data for all analysed objects.


